

With the increase in heat dissipation from microelectronics devices and the reduction in overall form factors, thermal management becomes a more a more important element of electronic product design.
Both the performance reliability and life expectancy of electronic equipment are inversely related to the component temperature of the equipment. The relationship between the reliability and the operating temperature of a typical silicon semi-conductor device shows that a reduction in the temperature corresponds to an exponential increase in the reliability and life expectancy of the device. Therefore, long life and reliable performance of a component may be achieved by effectively controlling the device operating temperature within the limits set by the device design engineers.
Heat sinks are devices that enhance heat dissipation from a hot surface,usually the case of a heat generating component, to a cooler ambient, usually air. For the following discussions, air is assumed to be the cooling fluid. Inmost situations, heat transfer across the interface between the solid surface and the coolant air is the least efficient within the system, and the solid-air interface represents the greatest barrier for heat dissipation. A heat sink lowers this barrier mainly by increasing the surface area that is in direct contact with the coolant. This allows more heat to be dissipated and/or lowers the device operating temperature. The primary purpose of a heat sink is to maintain the device temperature below the maximum allowable temperature specified by the device manufacturers.
Thermal Circuit
Before discussing the heat sink selection process, it is necessary to define common terms and establish the concept of a thermal circuit. The objective is to provide basic fundamentals of heat transfer for those readers who are not familiar with the subject. Notations and definitions of the terms are as follows:
Q: total power or rate of heat dissipation in W, represent the rate of heat dissipated by the electronic component during operation. For the purpose of selecting a heat sink, the maximum operating power dissipation issued.
Tj: maximum junction temperature of the device in °C.Allowable Tj values range from 115°C in typical microelectronics applications to as high as 180°C for some electronic control devices. In special and military applications, 65°C to 80°Care not uncommon.
Tc: case temperature of the device in °C. Since the case temperature of a device depends on the location of measurement, it usually represent the maximum local temperature of the case.
Ts: sink temperature in °C. Again, this represents the maximum temperature of a heat sink at the location closest to the device.
Ta: ambient air temperature in °C.
Using temperatures and the rate of heat dissipation, a quantitative measure of heat transfer efficiency across two locations of a thermal component can be expressed in terms of thermal resistance R, defined as
R = ![]() T/Q
T/Q
Were ![]() T is the temperature difference between the two locations. The unit of thermal resistance is in °C/W, indicating the temperature rise per unit rate of heat dissipation. This thermal resistance is analogous to the electrical resistance Re, given by Ohm’s law:
T is the temperature difference between the two locations. The unit of thermal resistance is in °C/W, indicating the temperature rise per unit rate of heat dissipation. This thermal resistance is analogous to the electrical resistance Re, given by Ohm’s law:
Re =![]() V/I
V/I
With ![]() V being the voltage difference and I the current.
V being the voltage difference and I the current.
 Figure 1: Thermal resistance circuit
Consider a simple case where a heat sink is mounted on a device package as shown in Fig 1. Using the concept of thermal resistance, a simplified thermal circuit of this system can be drawn, as also shown in the figure. In this simplified model, heat flows serially from the junction to the case then across the interface into the heat sink and is finally dissipated from the heat sink to the air stream.
The thermal resistance between the junction and the case of a device is defined as
Rjc = (Tjc)/Q = (Tj– Tc)/Q
This resistance is specified by the device manufacturer. Although the Rjc value of a give device depends on how and where the cooling mechanism is employed over the package, it is usually given as a constant value. It is also accepted that Rjc is beyond the user’s ability to alter or control.
Similarly, case-to-sink and sink-to-ambient resistance are defined as
Rcs = (![]() Tcs)/Q = (Tc– Ts)/Q
Tcs)/Q = (Tc– Ts)/Q
Rsa = (![]() Tsa)/Q = (Ts– Ta)/Q
Tsa)/Q = (Ts– Ta)/Q
respectively. Here, Rcs represents the thermal resistance across the interface between the case and the heat sink and is often called the interface resistance. This value can be improved substantially depending on the quality of mating surface finish and/or the choice of interface material. Rsa is heat sink thermal resistance.
Obviously, the total junction-to-ambient resistance is the sum of all three resistances:
Rja = Rjc + Rcs + Rsa= (Tj – Ta)/Q
Required Heat-Sink Thermal Resistance
To begin the heat sink selection, the first step is to determine the heat sink thermal resistance required to satisfy the thermal criteria of the component. By rearranging the previous equation, the heat sink resistance can be easily obtained as
Rsa = ((Ts – Ta)/Q) – Rjc– Rcs
In this expression, Tj, Q and Rjc are provided by the device manufacturer, and Ta and Rcs are the user defined parameters.
The ambient air temperature Ta for cooling electronic equipment depends on the operating environment in which the component is expected to be used. Typically, it ranges from 35 to 45°C, if the external air is used, and from 50 to 60°C, if the component is enclosed or is placed in a wake of another heat generating equipment.
The interface resistance Rcs depends on the surface finish, flatness, applied mounting pressure, contact area and, of course, the type interface material and its thickness. Precise value of this resistance,even for a give type of material and thickness, is difficult to obtain, since it may vary widely with the mounting pressure and other case dependent parameters. However, more reliable data can be obtained directly from material manufacturers or from heat sink manufacturers. Typical values for common interface materials are tabulated in Table 1.
| Material | Conductivity W/in °C |
Thickness inches |
Resistance in2 °C/W |
| There-O-Link Thermal Compound |
0.010 | 0.002 | 0.19 |
| High Performance Thermal Compound |
0.030 | 0.002 | 0.07 |
| Kon-Dux | 0.030 | 0.005 | 0.17 |
| A-Dux | 0.008 | 0.004 | 0.48 |
| 1070 Ther-A-Grip | 0.014 | 0.006 | 0.43 |
| 1050 Ther-A-Grip | 0.009 | 0.005 | 0.57 |
| 1080 Ther-A-Grip | 0.010 | 0.002 | 0.21 |
| 1081 Ther-A-Grip | 0.019 | 0.005 | 0.26 |
| A-Phi 220 @ 20psi | 0.074 | 0.020 | 0.27 |
| 1897 in Sil-8 | 0.010 | 0.008 | 0.81 |
| 1898 in Sil-8 | 0.008 | 0.006 | 0.78 |
| Table 1: Thermal properties of interface materials1 | |||
With all the parameters on the right side of the Rsa expression identified, it becomes the required maximum thermal resistance of a heat sink for the application. In other words, the thermal resistance value ofa chosen heat sink for the application has to be equal to or less than Rsa value for the junction temperature to be maintained at or below the specified Tj.
Heat-Sink Selection
In selecting an appropriate heat sink that meets the required thermal criteria, one needs to examine various parameters that affect not only the heat sink performance itself, but also the overall performance of the system. The choice of a particular type of heat sink depends largely to the thermal budget allowed for the heat sink and external conditions surrounding the heat sink. Itis to be emphasized that there can never be a single value of thermal resistance assigned to a given heat sink, since the thermal resistance varies with external cooling conditions.
When selecting a heat sink, it is necessary to classify the air flow as natural, low flow mixed, or high flow forced convection. Natural convection occurs when there is no externally induced flow and heat transfer relies solely on the free buoyant flow of air surrounding the heat sink. Forced convection occurs when the flow of air is induced by mechanical means, usually a fan or blower. There is no clear distinction on the flow velocity that separates the mixed and forced flow regimes. It is generally accepted in applications that the effect of buoyant force on the overall heat transfer diminishes to negligible level (under 5%) when the induced air flow velocity excess 1 2 m/s(200 to 400 lfm).
The next step is to determine the required volume of a heat sink.. Table 2shows approximate ranges of volumetric thermal resistance of a typical heat sink under different flow conditions.
| Flow condition m/s (lfm) |
Volumetric Resistance cm3 °C/W (in3 °C/W) |
|
| natural convection | 500-800 | (30-50) |
| 1.0 (200) | 150-250 | (10-15) |
| 2.5 (500) | 80-150 | (5-10) |
| 5.0 (1000) | 50-80 | (3-5) |
| Table 2: Range of volumetric thermal resistance | ||
The volume of a heat sink for a given low condition can be obtained by dividing the volumetric thermal resistance by the required thermal resistance. Table 2 is to be used only as a guide for estimation purposes in the beginning of the selection process. The actual resistance values may vary outside the above range depending on many additional parameters, such as actual dimensions of the heat sink, type of the heat sink, flow configuration, orientation,surface finish, altitude, etc. The smaller values shown above correspond to heat sink volume of approximately 100 to 200 cm3 (5 to 10 in3)and the larger ones to roughly 1000 cm3 (60in3).
The above tabulated ranges assume that the design has been optimized for a given flow condition. Although there are many parameters to be considered in optimizing a heat sink, one of the most critical parameters is the fin density. In a planar fin heat sink, optimum fin spacing is strongly related to two parameters: flow velocity and fin length in the direction of the flow. Table 3may be used as a guide for determining the optimum fin spacing of a planar fin heat sink in a typical applications.
| Fin length, mm (in) | ||||
| Flow condition m/s (lfm) |
75 3.0 |
150 6.0 |
225 9.0 |
300 12.0 |
| Natural convection | 6.5 0.25 |
7.5 0.30 |
10 0.38 |
13 0.50 |
| 1.0 (200) | 4.0 0.15 |
5.0 0.20 |
6.0 0.24 |
7.0 0.27 |
| 2.5 (500) | 2.5 0.10 |
3.3 0.13 |
4.0 0.16 |
5.0 0.20 |
| 5.0 (1000) | 2.0 0.08 |
2.5 0.10 |
3.0 0.12 |
3.5 0.14 |
| Table 3: Fin spacing (in mm/inches) versus flow and fin length | ||||
The average performance of a typical heat sink is linearly proportional to the width of a heat sink in the direction perpendicular to the flow, and approximately proportional to the square root of the fin length in the direction parallel to the flow. For example, an increase in the width of a heat sink by a factor of two would increase the heat dissipation capability by a factor of two,whereas and increase the heat dissipation capability by a factor of 1.4. Therefore , if the choice is available, it is beneficial to increase the width of a heat sink rather than the length of the heat sink. Also, the effect of radiation heat transfer is very important in natural convection, as it can be responsible of up to 25% of the total heat dissipation. Unless the component is facing a hotter surface nearby, it is imperative to have the heat sink surfaces painted or anodized to enhance radiation.
Heat Sink Types
Heat sinks can be classified in terms of manufacturing methods and their final form shapes. The most common types of air-cooled heat sinks include:
- Stampings: Copper or aluminum sheet metals are stamped into desired shapes. they are used in traditional air cooling of electronic components and offer a low cost solution to low density thermal problems. They are suitable for high volume production, because advanced tooling with high speed stamping would lower costs. Additional labor-saving options, such as taps, clips, and interface materials, can be factory applied to help to reduce the board assembly costs.
- Extrusion: These allow the formation of elaborate two-dimensional shapes capable of dissipating large heat loads. They may be cut, machined, and options added. A cross-cutting will produce omni-directional, rectangular pin fin heat sinks, and incorporating serrated fins improves the performance by approximately 10 to 20%, but with a slower extrusion rate. Extrusion limits, such as the fin height-to-gap fin thickness,usually dictate the flexibility in design options. Typical fin height-to-gap aspect ratio of up to 6 and a minimum fin thickness of 1.3mm, are attainable with a standard extrusion. A 10 to 1 aspect ratio and a fin thickness of 0.8″can be achieved with special die design features. However, as the aspect ratio increases, the extrusion tolerance is compromised.
- Bonded/Fabricated Fins: Most air cooled heat sinks are convection limited, and the overall thermal performance of an air cooled heat sink can often be improved significantly if more surface area can be exposed to the air stream. These high performance heat sinks utilize thermally conductive aluminum-filled epoxy to bond planar fins onto a grooved extrusion base plate. This process allows for a much greater fin height-to-gap aspect ratio of 20 to40, greatly increasing the cooling capacity without increasing volume requirements.
- Castings: Sand, lost core and die casting processes are available with or without vacuum assistance, in aluminum or copper/bronze. this technology is used in high density pin fin heat sinks which provide maximum performance when using impingement cooling.
- Folded Fins: Corrugated sheet metal in either aluminum or copper increases surface area and, hence, the volumetric performance. The heat sink is then attached to either a base plate or directly to the heating surface via epoxying or brazing. It is not suitable for high profile heat sinks on account of the availability and fin efficiency. Hence, it allows high performance heat sinks to be fabricated for applications.
Figure 2 shows the typical range of cost functions for different types of heat sinks in terms of required thermal resistance.
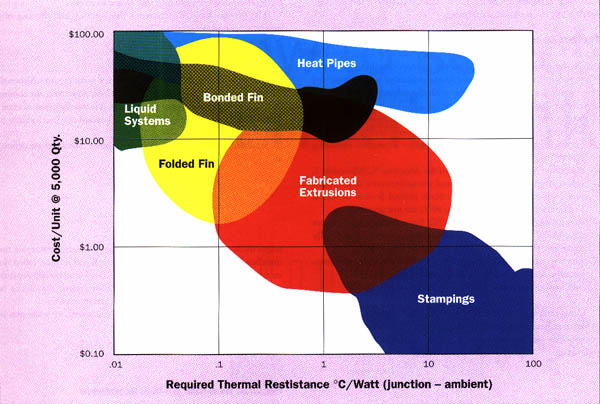 Figure 2: Cost versus required thermal resistance
The performance of different heat sink types varies dramatically with the air flow through the heat sink. To quantify the effectiveness of different types of heat sinks, the volumetric heat transfer efficiency can be defined as
 where, m is the mass flow rate through the heat sink, c is the heat capacity of the fluid, and
![]() Tsa is the average temperature difference between the heat sink and the ambient air. The heat transfer efficiencies have been measured for a wide range of heat sink configurations, and their ranges are listed in Table 4.
Tsa is the average temperature difference between the heat sink and the ambient air. The heat transfer efficiencies have been measured for a wide range of heat sink configurations, and their ranges are listed in Table 4.
| Heat sink type | n range, % |
| Stamping & flat plates | 10-18 |
| Finned extrusions | 15-22 |
| Impingement flow Fan heat sinks |
25-32 |
| Fully ducted extrusions | 45-58 |
| Ducted pin fin, Bonded & folded fins |
78-90 |
| Table 4: Range of heattransfer efficiencies | |
The improved thermal performance is generally associated with additional costs in either material or manufacturing, or both.
Thermal Performance Graph
| Performance graph typical of those published by heat sink vendors are shown in Fig. 3. The graphs are a composite of two separate curves which have been combined into a single figure. It is assumed that the device to be cooled is properly mounted, and the heat sink is in its normally used mounting orientation with respect to the direction of air flow. The first plot traveling from the lower left to the upper right is the natural convection curve of heat sink temperature rise, |
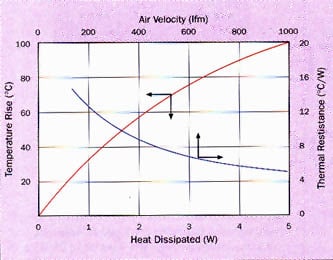 Figure 3: Typical performance graphs |
One can use the performance graphs to identify the heat sink and, for forced convection applications, to determine the minimum flow velocity that satisfy the thermal requirements. If the required thermal resistance in a force convection application is 8 °C/W, for example, the above sample thermal resistance versus flow velocity curve indicates that the velocity needs to be at or greater than 2.4 m/s (470 lfm). For natural convection applications, the required thermal resistance Rsa can be multiplied by Q to yield the maximum allowable ![]() Tsa. The temperature rise of a chosen heat sink must be equal to or less than the maximum allowable
Tsa. The temperature rise of a chosen heat sink must be equal to or less than the maximum allowable ![]() Tsa at the same Q.
Tsa at the same Q.
The readers are reminded that the natural convection curves assume an optional orientation of the heat sink with respect to the gravity. Also, the flow velocity in the forced convection graph represent the approach flow velocity without accounting for the effect of flow bypass. There have been a limited number of investigations2,3 on the subject of flow bypass. These studies show that flow bypass may reduce the performance of a heat sink by as much as 50% for the same upstream flow velocity. For further consultation on this subject, readers are referred to the cited references.
When a device is substantially smaller than the base plate of a heat sink,there is an additional thermal resistance, called the spreading resistance, that needs to be considered I the selection process. Performance graphs generally assume that the heat is evenly distributed over the entire base area of the heat sink, and therefore, do not account for the additional temperature rise caused by a smaller heat source. This spreading resistance could typically be 5 to 30%of the total heat sink resistance, and can be estimated by using the simple analytical expression developed in Reference 4.
Another design criterion that needs to be considered in the selection of a heat sink, is the altitude effect. While the air temperature of an indoor environment is normally controlled and is not affected by the altitude change,the indoor air pressure does change with the altitude. Since many electronic systems are installed at an elevated altitude, it is necessary to derate the heat sink performance mainly due to the lower air density caused by the lower air pressure at higher altitude. Table 5 shows the performance derating factors for typical heat sinks at high altitudes. For example, in order to determine the actual thermal performance of a heat sink at altitudes other than the seal level, the thermal resistance values read off from the performance graphs should be divided by the derating factor before the values are compared with the required thermal resistance.
| Altitude m/ft |
Factor |
| 0, sea level | 1.00 |
| 1000 3000 | 0.95 |
| 1500 5000 | 0.90 |
| 2000 7000 | 0.86 |
| 3000 10000 | 0.80 |
| 3500 12000 | 0.75 |
| Table 5: Altitude derating factors | |


 Send Email